graphPlot
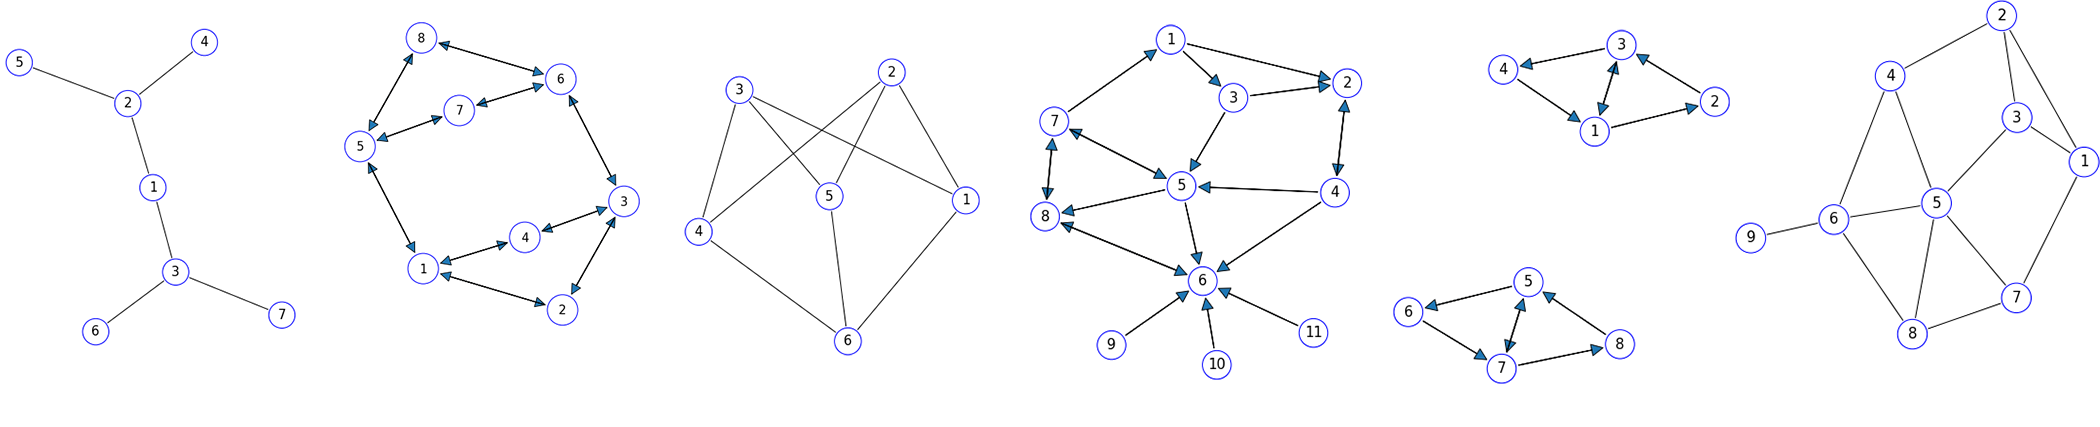
Here we model graphs as systems of charged particles, connected by springs, in order to determine "optimal" plotting positions for nodes.
After installing, import the graphPlot module into your python environment
from graphPlot import *
View the docString comments for each function with the a help() call:
help(graphPlot)